
EMERSON STEPP MArch
Information
Information graphics are an under-appreciated asset in an architectural project. A good infographic can often explain relationships, or complex ideas more completely and certainly faster than a verbal explaination ever could. More importantly, infographics provide abstract numbers or ideas with something concrete that allows a viewer to see rather than imagine the point the designer is making.


MCB Building
This is an investigation of the energy performance of the Molecular and Cellular Biology Building on the University of Minnesota Campus. Based on pre-build energy projections and actual overall usage, we calculated and visualized how the energy use was distributed to the constituent elements. This was a team project; however, the diagrams shown are ones I was personally responsible for.


Growing Carbon
This is an investigation on the carbon sequestration potential of tree planting, growing, maintaining, and disposal in an urban setting.
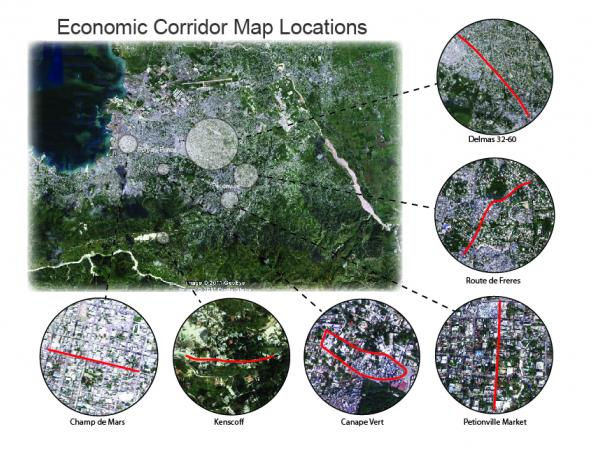


Economic Corridor Mapping
While volunteering with Architecture for Humanity in Haiti, through the University of Minnesota, I had the opportunity to work on the mapping and analysis of various informal economic corridor marketplaces. Along with my fellow U of M collegues and AFH staff we spent a day at each location mapping the conditions and traffic to better understand the organization and key components.

A conceptual visualization of the relationships between key elements which are representative of the purpose of the proposed New Nicollet Village.

Similar to the purpose diagram, this is a conceptual visualization of the relationships between key elements which are representative of the essence of the proposed New Nicollet Village.

This is a visualization of the relationship between Tokyo's urban sprawl and its rail system. The black is an inverted image of tokyo at night used to represent sprawl.
A conceptual visualization of the relationships between key elements which are representative of the purpose of the proposed New Nicollet Village.
Various projects
This is a collection of information visualizations from a variety of projects that illustrate the variety of information that can be visualized graphically.